Understanding Django Monitoring: Metrics, Logs, System Design
Many Django applications run for a long time "just fine." Requests come in, data is processed, responses go out. As long as nothing is obviously broken, the system feels stable.

Bernd Fischer
26. Mar 2026 · 5 min read

The problem only becomes apparent when something stops working. Suddenly the application is slow, errors occur, or individual requests take unusually long. Without monitoring, you're often left guessing in such moments. Logs help only to a limited extent because they do not provide an overview. This is exactly where monitoring begins.
What is monitoring really?
Monitoring means continuously observing the state of a system and making it measurable. It's not just about seeing errors, but understanding how the system behaves.
We broadly distinguish two types of data:
- Metrics, i.e., measurable values like number of requests or response times
- Logs, i.e., specific events and error messages
Metrics answer questions such as "How many requests per second does the system handle?" or "How long do responses take on average?" Logs, on the other hand, provide context, for example why a particular request failed.
Together, they provide a more complete picture.
Understanding the system
A good monitoring system clearly separates these two types of data and unifies them in one place. In the Django context, this typically looks like:
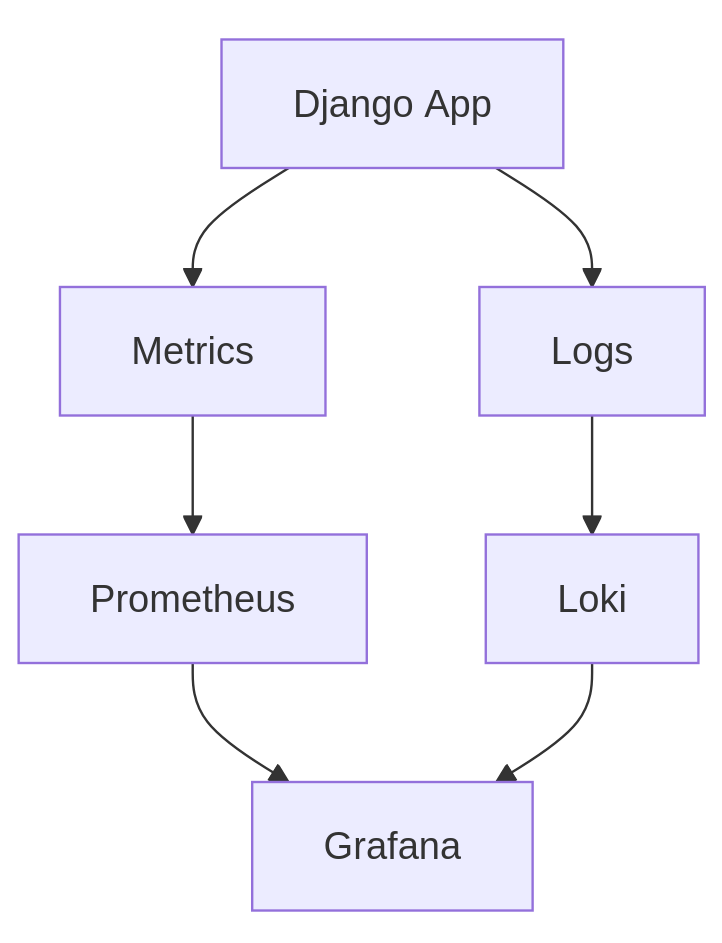
The Django application generates both metrics and logs. Metrics are collected by Prometheus, while logs are processed through a system like Loki. Both data streams are ultimately combined in Grafana, where they are visualized.
The important aspect here is not the specific tool but the structure. Metrics and logs are processed separately but evaluated together.
Understanding metrics
Metrics are aggregated, numerical data. They help to understand the behavior of a system over time.
Typical examples in a Django application include:
- Number of requests per second
- Average response time
- Error rate (e.g., HTTP 500)
These values enable the recognition of trends. You can see whether the load is increasing, certain endpoints are slowing down, or errors occur more frequently.
The great advantage of metrics is their efficiency. They can be captured and evaluated very quickly. Therefore, they are especially suitable for dashboards and alerts.
Understanding logs
Logs are more detailed and concrete. They contain information about individual events, such as a failed request or an exception.
A typical log entry might include:
- Timestamp
- Affected endpoint
- Error message
- Context data
Logs are indispensable when it comes to analyzing problems in detail. While metrics show that something is going wrong, logs explain why it is happening.
The downside is that logs are more difficult to evaluate. They are unstructured and often very voluminous. That is why specialized systems are needed to search them usefully.
Interaction of metrics and logs
The real added value only arises through the interplay of both data sources.
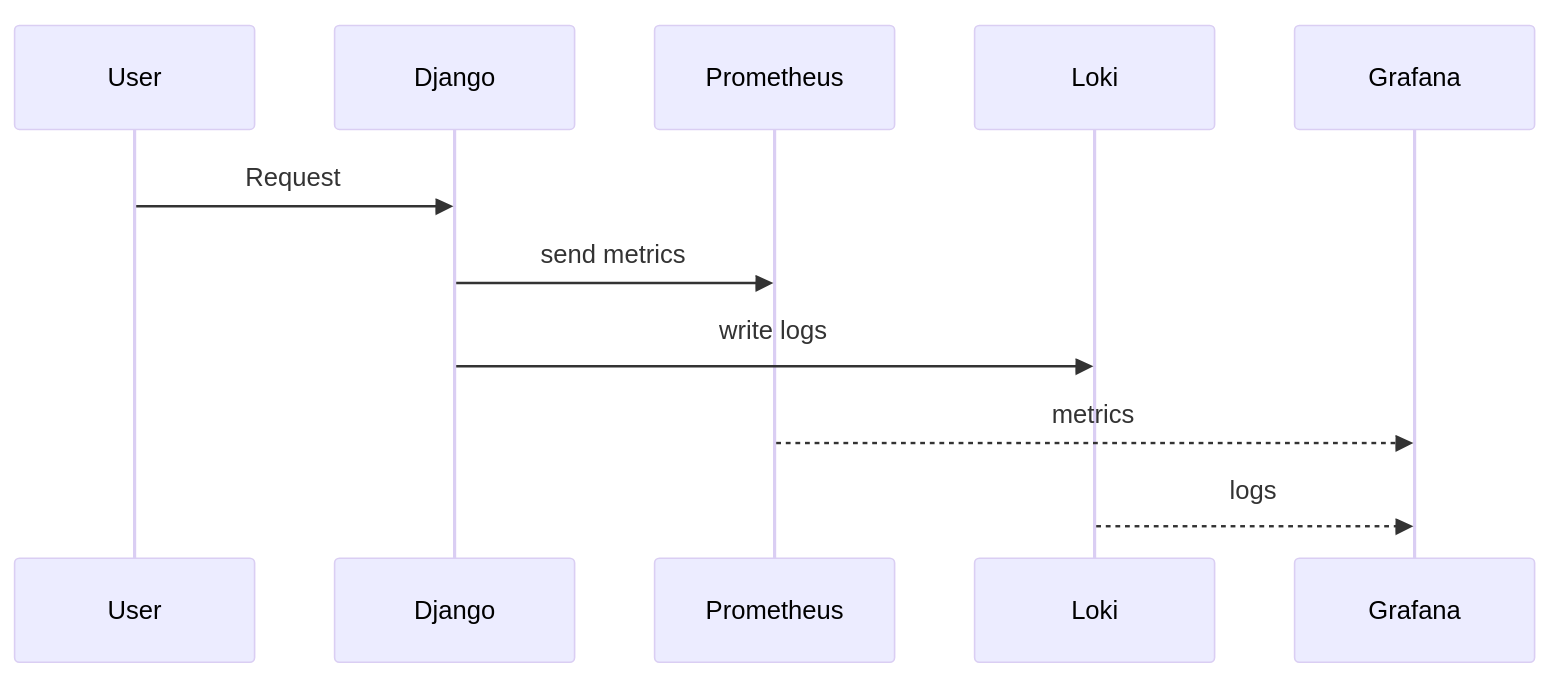
A request hits the Django application. During processing, both metrics are generated and logs are written. This data is collected in parallel and later analyzed together.
In Grafana, for example, you can then see that response times are rising and simultaneously access the corresponding logs. Only this combination enables a sound analysis.
What does this look like in practice?
At this point, it is worth looking at a real dashboard.
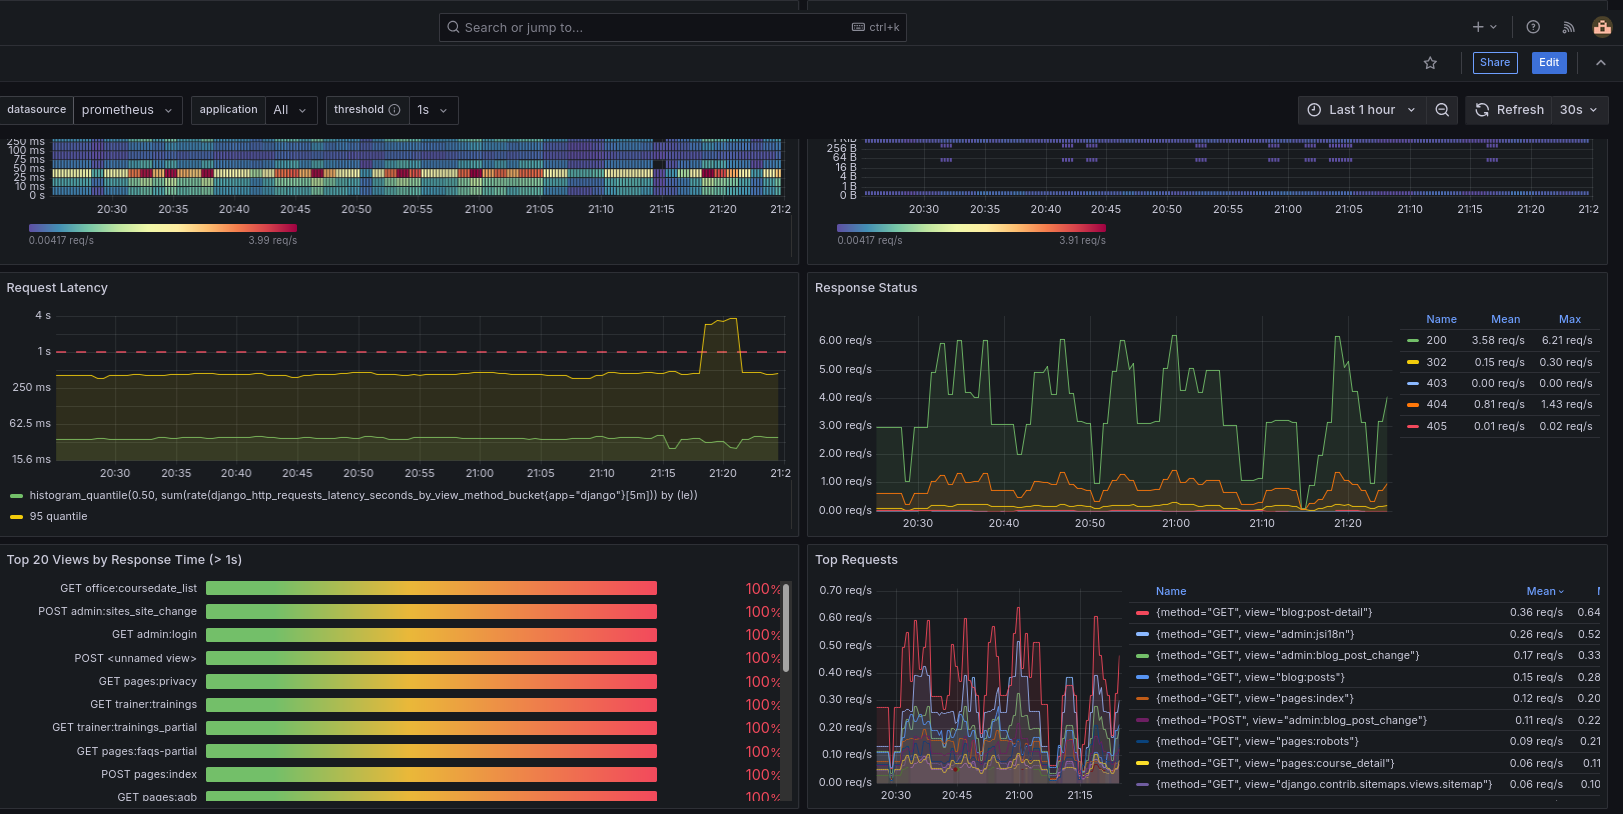
A typical Grafana dashboard shows:
- Request rates over time
- Response times of individual endpoints
- Error rates
- Possibly system metrics like CPU or memory
The decisive point is not the individual chart but the overall view. You recognize patterns, correlations, and changes within the system.
Why monitoring is part of system design
Monitoring is often seen as a retroactive feature. Only when problems arise does one begin to think about it.
This is a mistake.
Monitoring is an integral part of system design. It determines whether a system can be observed at all. Without this observability, neither performance issues nor errors can be reliably analyzed.
A well-designed system ensures that:
- relevant metrics are available
- logs are structured and accessible
- data can be centrally evaluated
Relation to Django architecture
Monitoring is closely tied to the structure of the application. If logic is distributed unclearly, monitoring will also be difficult.
A cleanly structured service layer helps, for example, to capture metrics purposefully and write logs at meaningful points:
👉 Services in Django – clean separation of logic
At the same time, many problems arise precisely due to missing structure:
👉 Why 90% of all Django projects become unmaintainable
And what a clean overall structure looks like is explained in detail here:
👉 How a maintainable Django project is structured
Conclusion
Django applications are not just code but systems. These systems must be observable to remain stable in the long term.
Metrics show how a system behaves. Logs explain why it behaves that way. Only together do they enable real understanding.
The developer's role has thus changed. It is no longer sufficient to implement features. It is about designing systems that are scalable, maintainable, and traceable.
Monitoring is not an optional extra but a central component of this architecture.